Requests for topics for future discourses.
Categories
Requests for topics for future discourses.
Collecting inputs
Currently a request for comments and inputs to craft a discourse.
Factoids like
gun deaths in different countries
handgun deaths vs. long arm deaths
deaths by suicide vs. murder
etc.
Inputs more than welcome!
This is a short and sweet discourse. One way we can reduce taxes is to cut spending. Discourse #1 assumed no change to spending to balance the budget but reducing expenses is the other lever. Rather than a lengthy discussion, we’ll use the outstanding efforts of the NY Times in showing how much cuts in different areas can reduce total expense. Like the Tax Scenario calculator, you can make your own choices (and circulate your results to others) by going to the following site:
Once you come up with a spending plan you may want to go back and adjust your tax scenario to arrive at a balanced budget.
Take all the trees. Put ‘em in a Tree Museum.
Charge everybody $35,000.00 just to see ‘em!!
a.k.a. What IS my Fair Share?
a.k.a. Are you a contributing member of Society?
Almost everyone, except our elected representatives see that there is a critical need to narrow the budget deficit in fairly short order. With apologies to Joni Mitchell, whose lyrics I’ve co-opted to suggest one means to close the gap, there must be more rational ways than charging every US Citizen about $35,000.00, the amount needed to pay off the US debt. I’ll propose a fairly simple analysis to see what it would take to simply close the deficit for ONE year. The readers will also be able to propose their own alternative tax scheme to close the gap. Though I’m technically not one of the top 1%, you need to have an income of $384,000.001, I am closing on it and I do wonder what people mean when they expect the rich to pay their “fare share”. I’ve never seen my fair share really described in terms other than “more” so this will allow you to tell me, ne EVERYONE what you think their “fair share” is quantitatively.
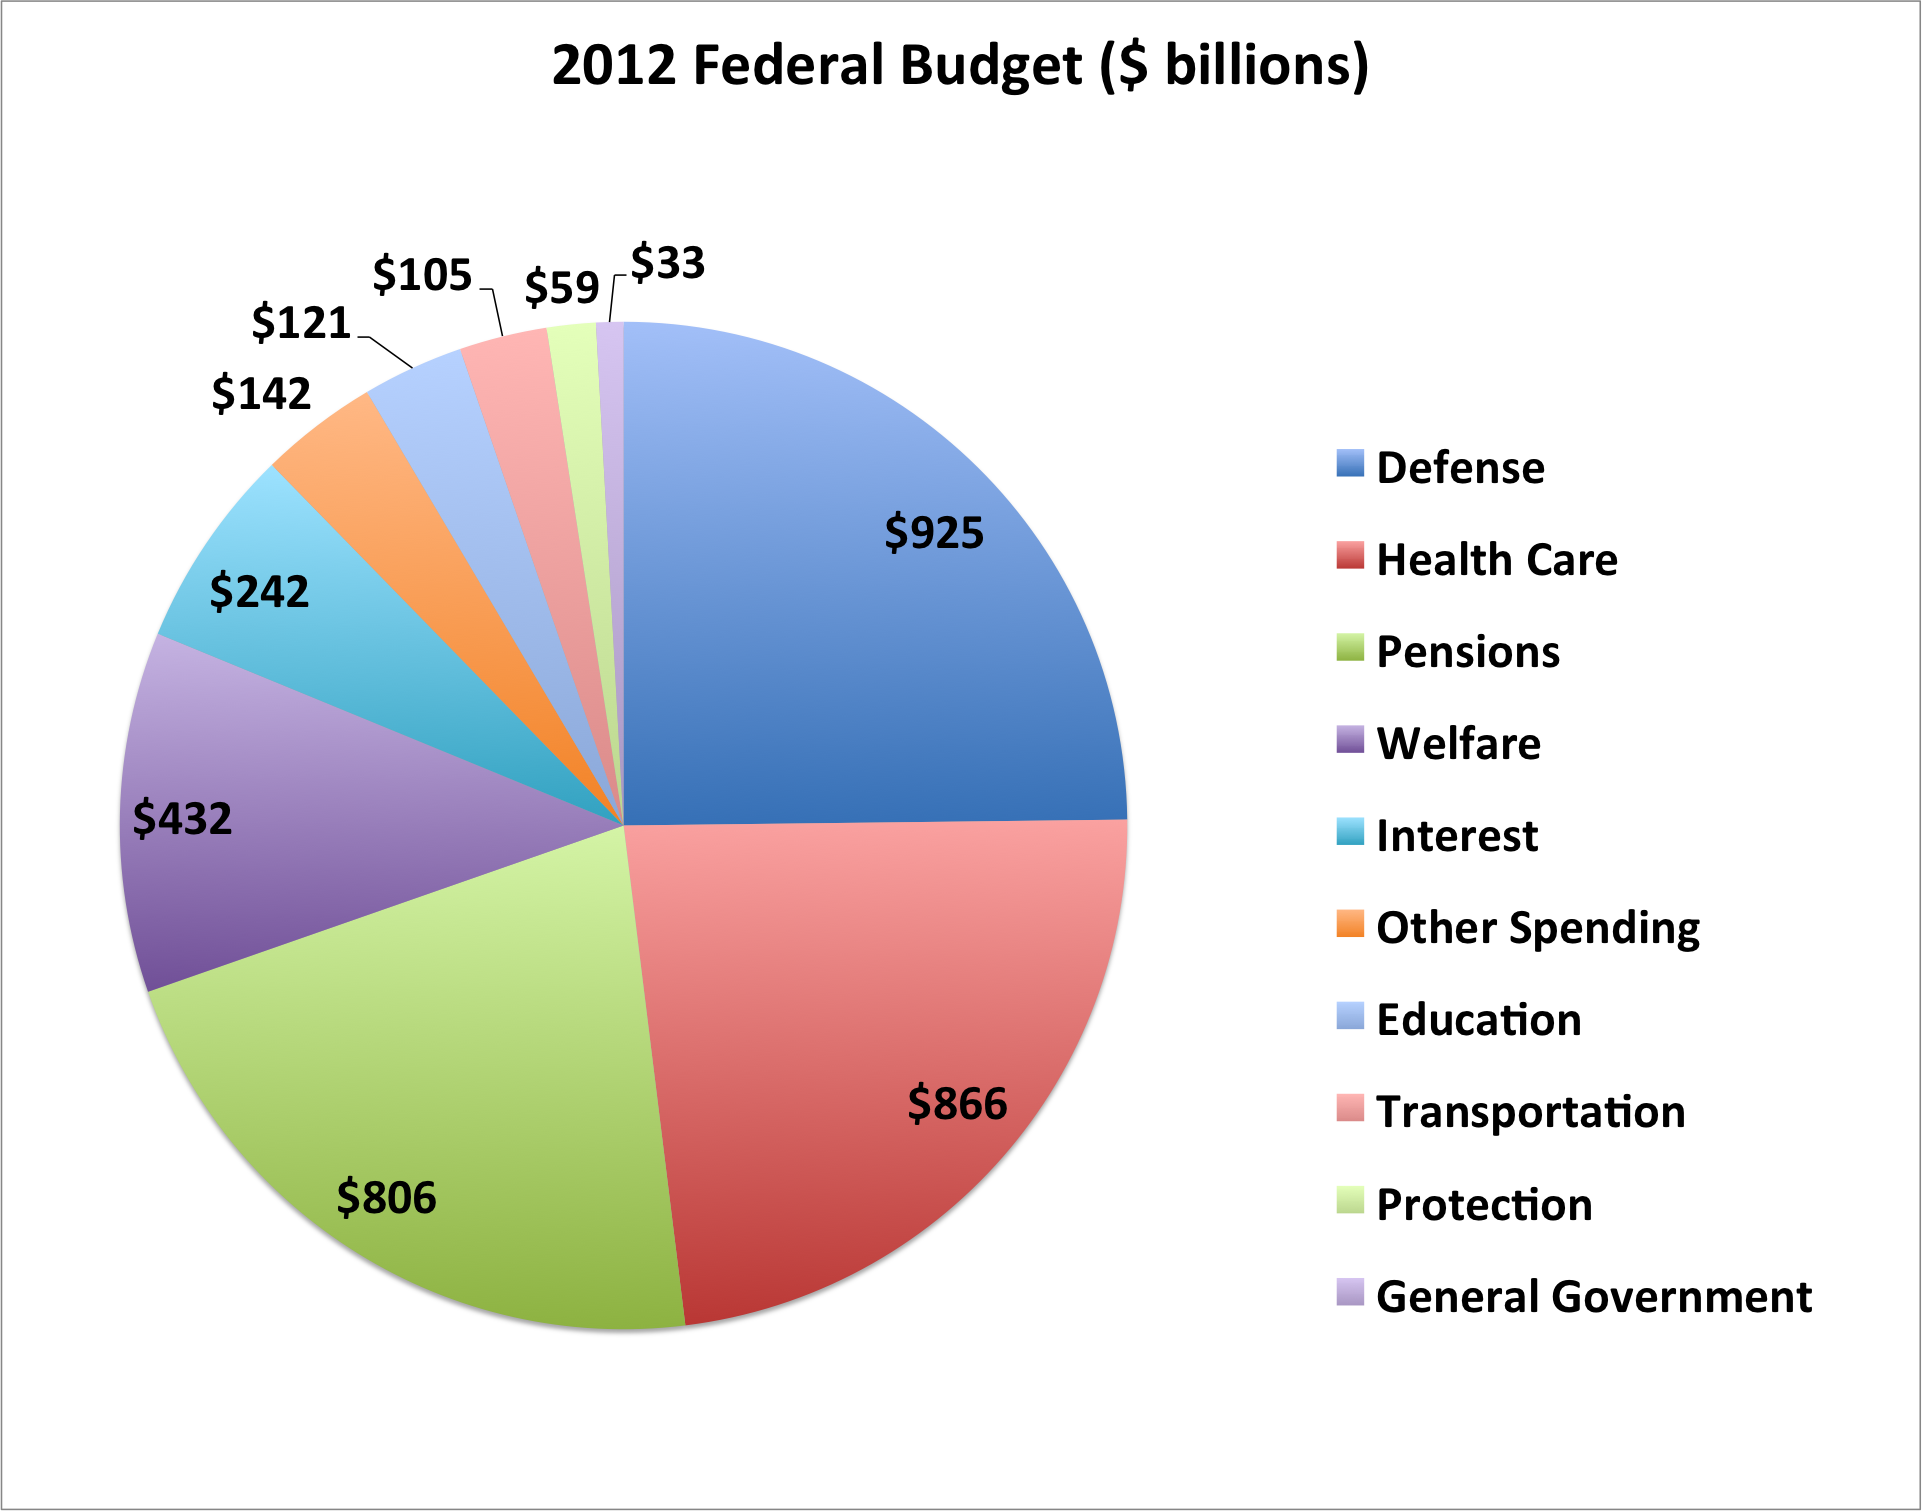
Let’s first look at the magnitude of the problem (budget deficit), make some hopefully rational simplifying assumptions and then let you, the reader play countless “what if” games to close the deficit. So, first, how big is the federal budget and where does it go. The simple answer is that in 2012 the US budget calls on expenditures2 of 3,728,690,000,000.00. That’s 3.728 TRILLION dollars, don’t get lost in all the 0’s – that’s 3.728 million million dollars! People are usually curious where it all goes so here is a fairly simple breakdown of how we spend our money. You may need this in a future installment if you decide to continue reading this series but for now it’s just for informational purposes.
These expenses are offset by two sources, revenue and borrowing. Borrowing represents $1.1 Trillion and revenues represent $2.6 trillion2. A similar analysis of revenue3 sources produces the following chart:
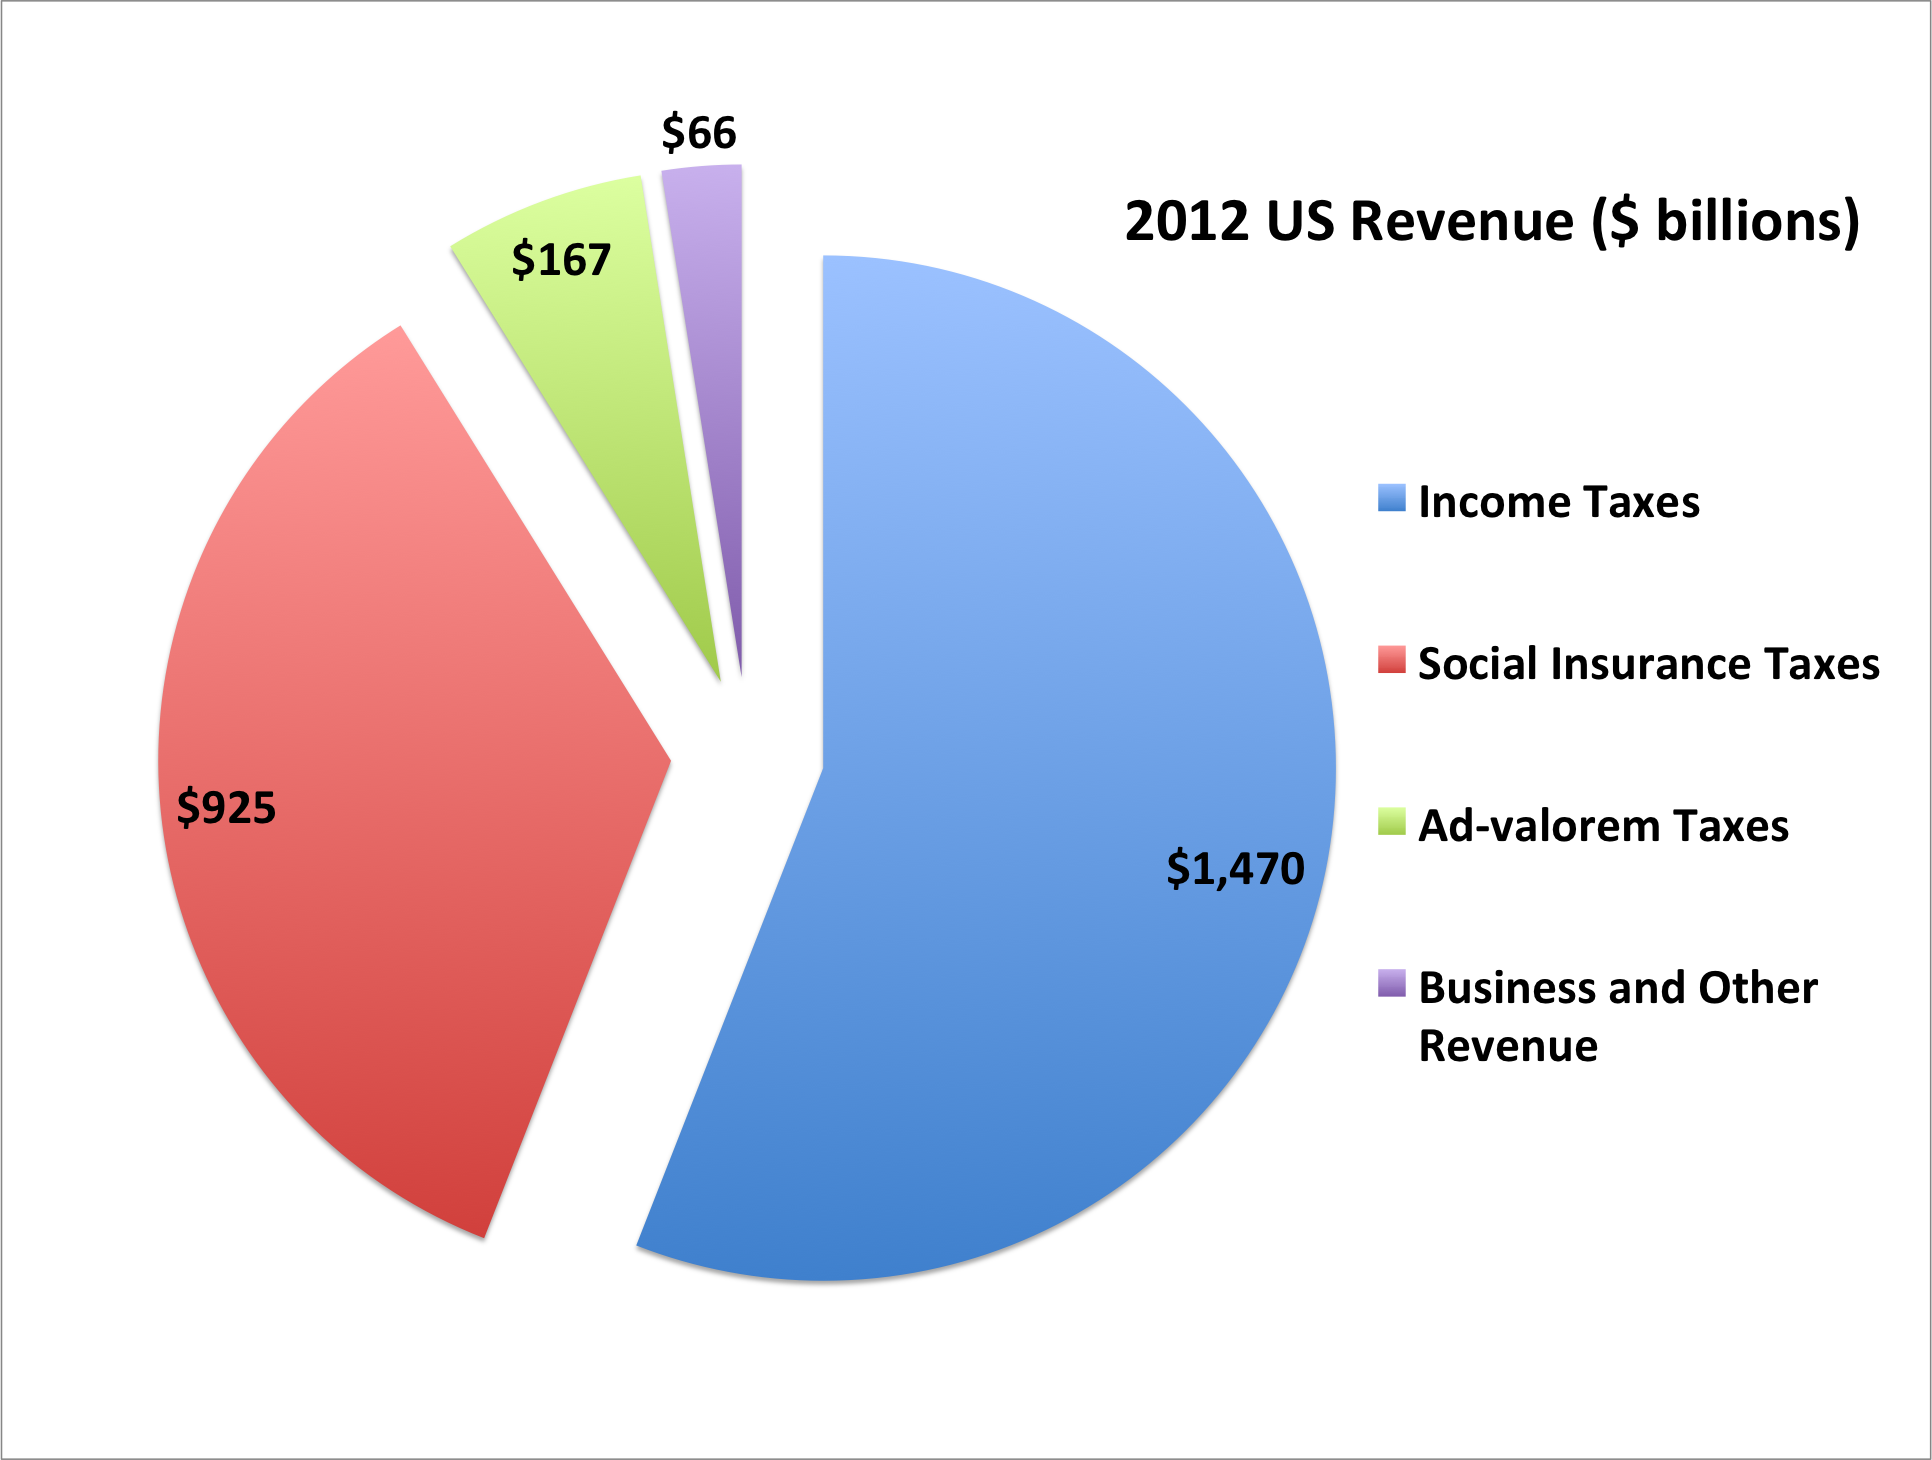
So $1.47 Trillion of the $2.63 Trillion (or about 56%) comes from income taxes. I’m going to make an assumption now that to balance the budget we simply scale all sources of revenue by the amount needed to balance the budget. To accomplish this, income taxes will have to be increased (for now – we’ll have other options in a phase II analysis) to $2.1 Trillion. To do that, let’s first look at our total collective income and how it’s distributed amongst 6 groups of people. As a country our Total Income in 2006 (if you have more recent data I will use it) was approximately $8.077 Trillion dollars.
That income was distributed amongst the following groups:
The 90% of incomes at the bottom of the distribution
The next 5% of incomes (90% – 95% of incomes)
The next 4% of incomes (9%%-99% of incomes)
And then we’ll split the oft-mentioned Top 1% into 3 further groups
The next .5% of incomes (99% – 99.5% of incomes)
The following .4% of incomes (99.5%-99.9% of incomes)
And the remaining TOP .01% of incomes
That produces a distribution of incomes chart as below that shows, for example, that the lowest 90% of incomes comprise 50% of the total income in the US.
The cutoffs for those incomes are as follows5 (see sidebar):
Group Cutoff Income Average Income Number of Incomes
Bottom 90% $0 $30,659 133,524,900
Top 10% $104,366 $122,359 7,418,050
Top 5% $147,839 $207,707 5,934,440
Top 1% $376,378 $458,208 741,805
Top .5% $592,681 $956,460 593,444
Top .1% $1,909,872 $3,707,091 133,525
Top .01% $10,482,368 $29,726,899 14,836
So, in 2006, to be in the “Top 1%” you needed an income of $376,378. Another cut on this shows the AVERAGE income for each member of this group and the number of people in that group (note, this is much smaller than the total number of people in the US as it is by number of tax returns and not all people file tax returns, legally or illegal
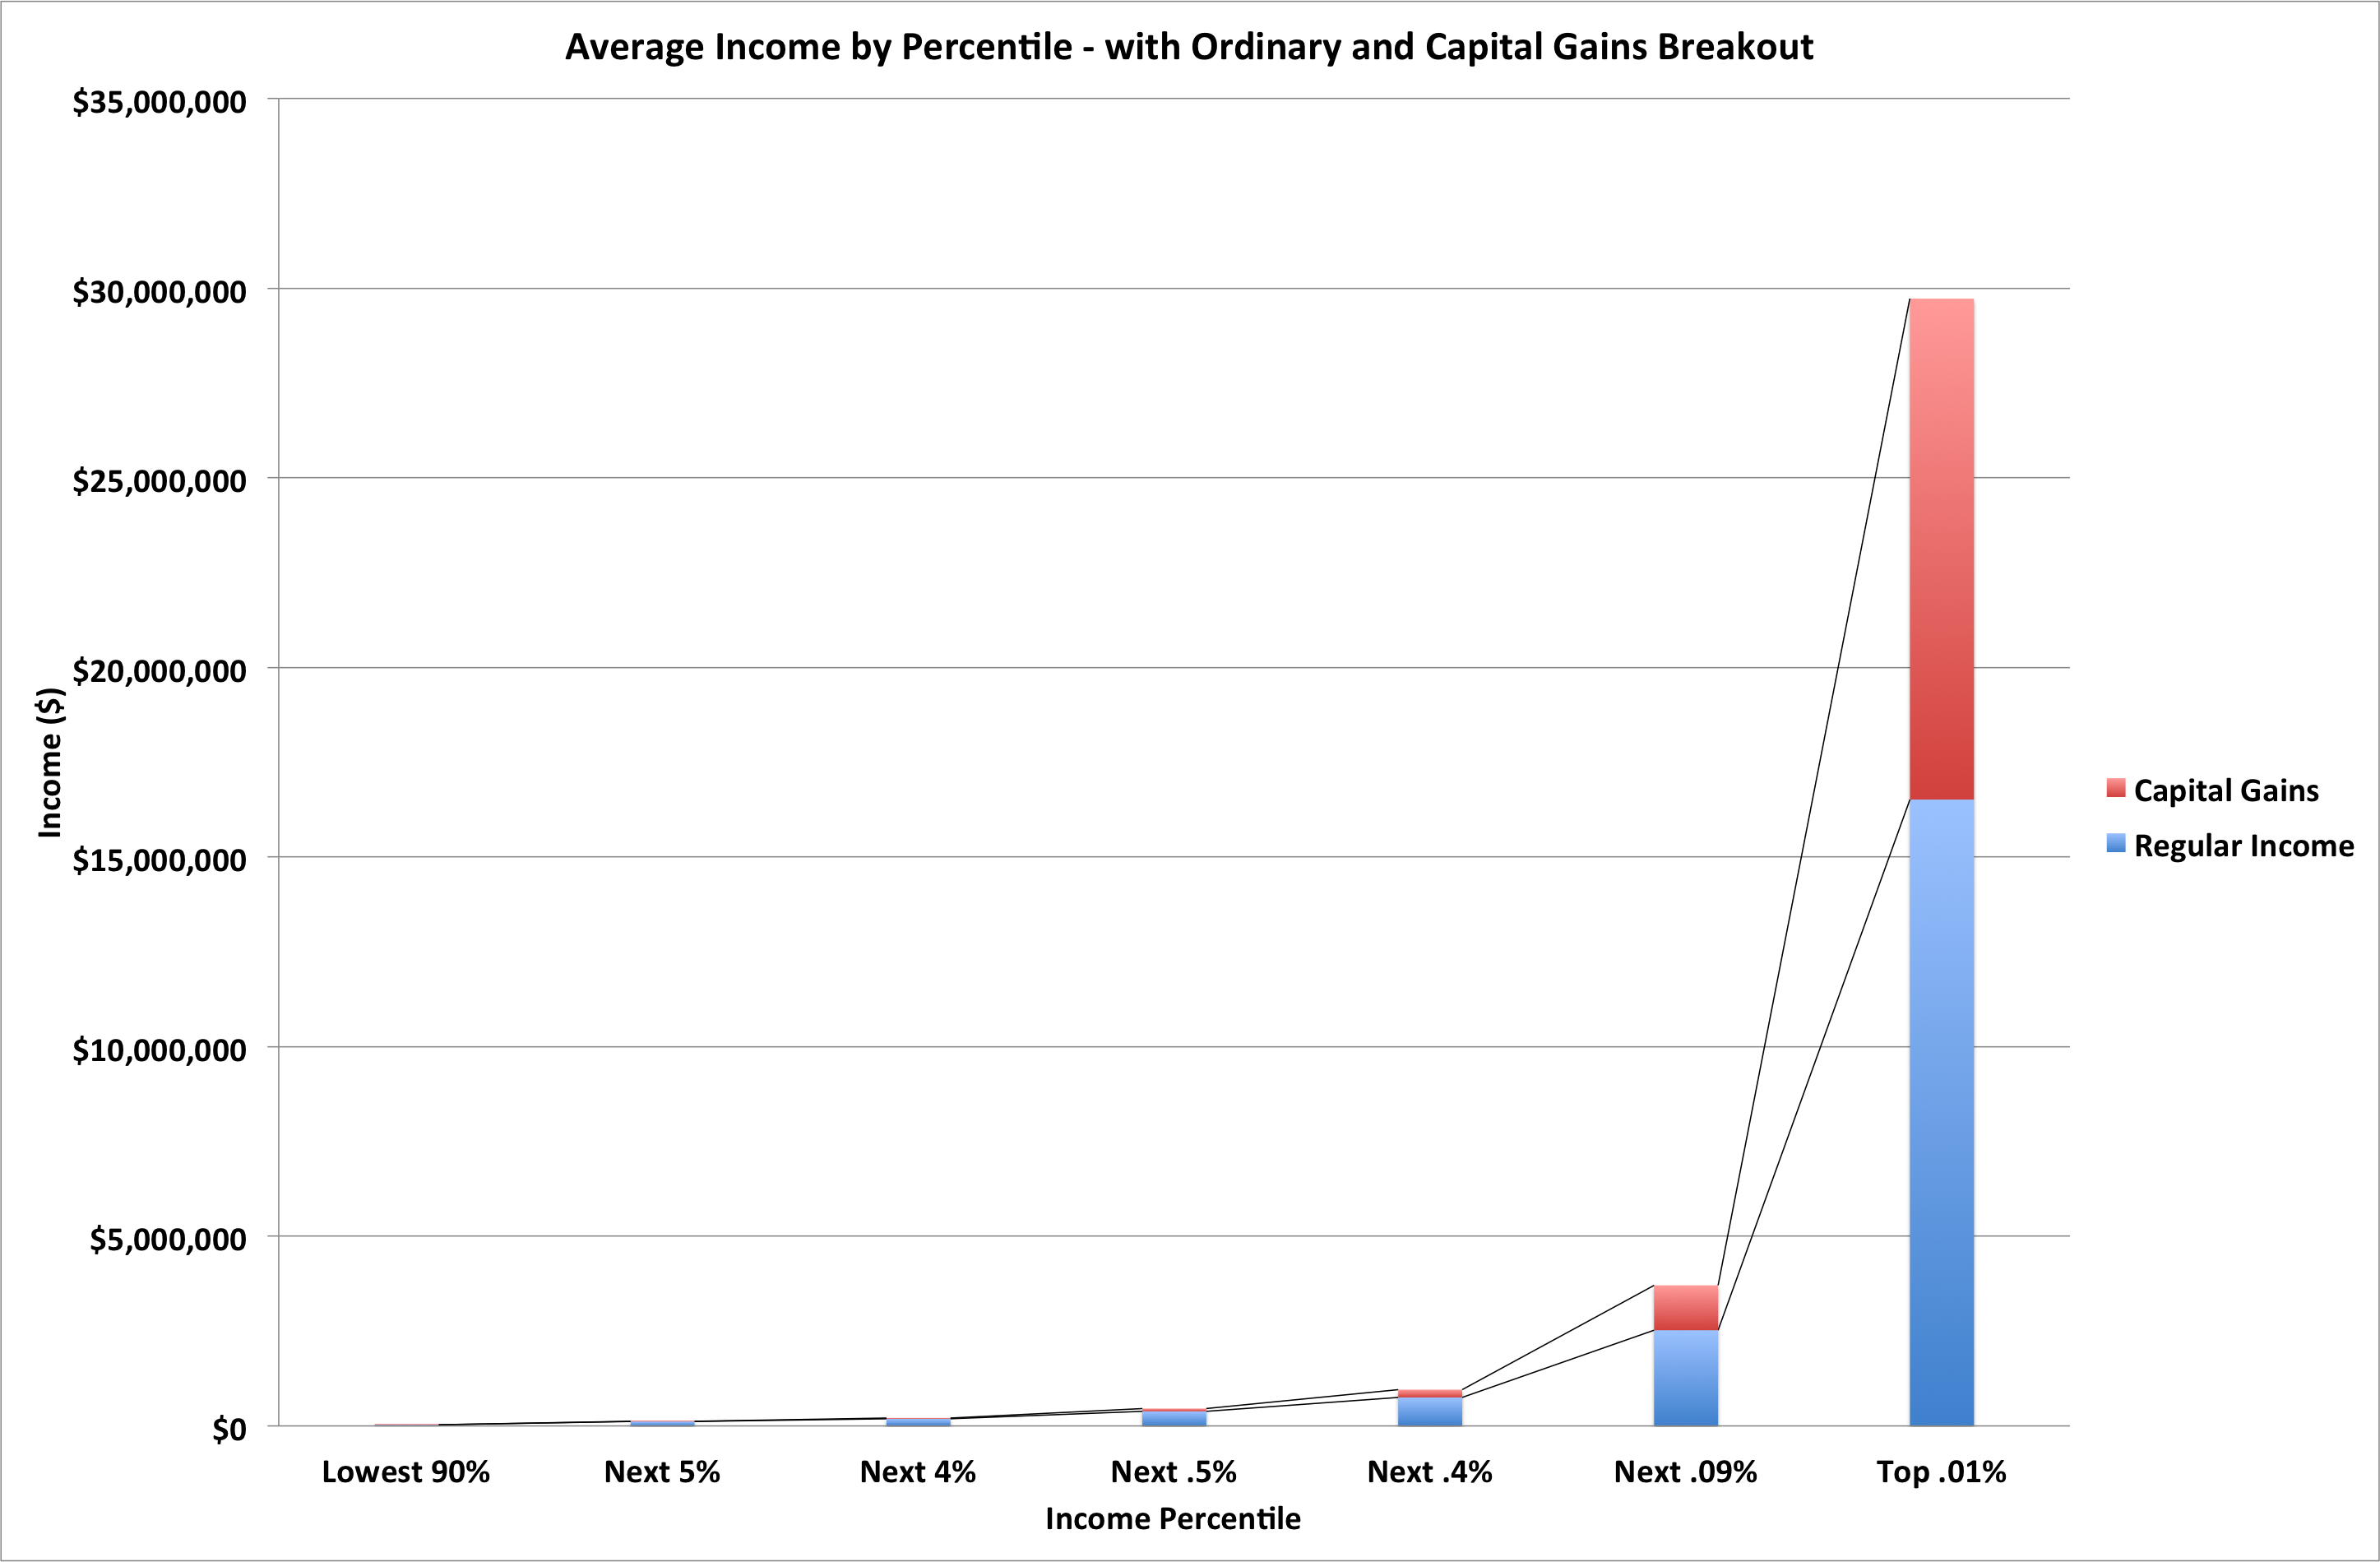
Plotting this in the most “inflammatory” way I imagined to accentuate the ratio between the lowest and highest incomes produces the following graph. We’ll use this as a “guide” in assigning tax brackets next. The chart also shows the breakout by percentile into “ordinary income” and “capital gains” as there is considerable discussion concerning differing tax rates on these different types of income.
Now that we have the preliminaries out of the way, we can get to your portion of the fun and frivolity!! This link contains a spreadsheet that will allow you to experiment with tax rates for ordinary income and capital gains to answer some questions I (and hopefully you) may find interesting. Again, there are some simplifying assumptions in this spreadsheet. Firstly, it only allows tax rate changes at the breakpoints I picked, not arbitrary ones. Secondly, there are no “deductions” or “credits” or other attempts to encourage or discourage specific behaviors. In 1913, when the income tax was introduced, the law consisted of 400 pages of law, a substantial tractable amount of law. Today there are 70,0006 pages and Americans spend 7.6 BILLLION HOURS dealing with them. There is a large outcry to simplify the tax code and what I have here (just an explanation of the tax code) would take about a page, likely less. (previous sentence from Ref. 6 below) (Editorial Comment: These deductions and credits are a source of countless hours of amusement for all involved as politicians endlessly debate how to encourage “investment” in certain areas of our society by providing tax incentives to do so and then shamelessly lambasting “the rich” for answering the call and jointly making the desired investment while reducing their taxes. If disingenuous needed a definition, politicians would clearly supply a superb answer here as well as in most of their behaviors.)
The spreadsheet does allow for differing tax rates for ordinary income and capital gains. This is a topic of considerable debate as to “fairness” and “encouraging investment”. This discussion doesn’t address either, other than to show my bias because the default tax rates represent my personal answers to the tax debate question.
The inputs for the spreadsheet are
Income Needed from Income Taxes – by default it’s the scaled amount to be raised by income taxes (in discourse #2, we’ll take a journey into another way to close the budget deficit – spending cuts!). If you cut spending in discourse 2, you can enter a different number here.
14 tax rates – an “ordinary income rate” and a “capital gains” rate for each of the 7 income levels. There are sliders to adjust the 14 rates.
Income – an input cell to calculate the taxes on any arbitrary income. This is in case you want to calculate your own taxes with the system you devise or someone else proposes. (Note: I keep no history of entries. Your entries will be completely private unless you decide to publish them.)
I encourage you to play with the spreadsheet and post your preferred rates and the rationale behind them as a reply to this post or to simply reply to me directly if you don’t want your answers to be “public”. I welcome corrections to my data or suggestions for improvement to this analysis. If the references are wrong or more up to date, please provide better ones. If there are errors, please point them out and correct them.
Thus far we have covered Joni Mitchell’s solution – the tree museum. There is an opportunity for anyone to tell me what my “fair share” of taxes might comprise. The remaining question may be somewhat controversial in that it attempts to answer the question of who is a “Contributing Member” of Society, as defined solely by their income tax contribution. Two thoughts have occurred to me in this regard though undoubtedly there are many others and I solicit your thoughts in this regard. My two thoughts are simply as follows:
1) The lowest possible bound for contributing member as defined this way is “Someone who pays taxes.” If you pay no taxes it seems axiomatic that you are not contributing, you are “on welfare”.
2) The most stringent bound that I can think of is that you pay more than the “average” tax burden. In other words if you take the amount needed to be raised by income taxes and divided it by the total number of taxpayers, you would be a contributing member of society if you paid more than that amount. In this analysis, it means that the $2.1 Trillion would need to be split evenly amongst all taxpayers and only people paying more than $14,155 or so would be “contributing members”. All others are subsidized.
The really interesting thing about this analysis is that we can make more people “contributing” members by boosting incomes to get them over the hurdle. Or, and this appeals vastly more to me, we can cut the budget and effectively lower the bar to becoming a “contributing” member. In the end game of extremely low government spending, nearly everyone can be a “contributing” member.
Future Rational Discourse Opportunities:
Cutting Expenditures – this analysis assumes spending as is. Taxes can be cut from this level by spending cuts. This will be addressed in Discourse #2
Alternative taxation – Despite massive expenditures on education, the only factor that reduces smoking is the price of a pack of coffin nails. If you want to discourage something, tax it! Imagine we wanted to encourage income and we wanted to reduce our dependence on foreign oil, encourage mass transit and reduce CO2 emissions. We could ELIMINATE the income tax and replace it with a tax on oil. Currently, the US consumes 19.15 million barrels of oil a day7 or 7 billion barrels a year. To generate the necessary income we would need to add a tax of $300 a barrel. As of this writing, Brent crude is selling for $118 a barrel, so we would have to more than triple the cost of oil. This would produce gasoline prices of roughly $12.50 a gallon. Europe is spending about $8 a barrel currently and people still seem to drive there! So, you have to ask your self “Would I be willing to pay $12.50 a gallon for gas in exchange for ELIMINATING income tax?” I know I would!
Target Inflation – currently this is set to zero and has no impact but I welcome someone with a monetary background to propose a way to discuss and arrive at a target inflation rate for a currency. My gut tells me 0 is the only answer that doesn’t effectively institute a “cash tax” based on ones cash holdings and income. Similarly, it involves a fairly powerful means to transfer income to the rich as they seek out inflation-protected investment incomes.
Target Growth – currently this is set to zero and does not allow the economy to “grow itself” out of debt in a % of GDP sense. Again I welcome someone with a monetary background to propose a way to discuss and arrive at a target growth rate for a society. I personally am quite skeptical of this as it is the method used by politicians to kick the can down the road but maybe someone can articulate a rational reason to include it.
1) Footnote on breakpoint for the top 1% of wage earners tax returns
2) http://www.usgovernmentspending.com/federal_budget_fy12bs12012n
3) http://quickfacts.census.gov/qfd/states/00000.html
4) http://www.usgovernmentrevenue.com/yearrev2012_0.html
5)
6) http://www.economist.com/node/15867984